coin.click zeigt dir alle Cryptocurrency Coins & Token auf einem Blick.
Finde schnell die High Market Cap Coins oder die Newcomeroder sortiert nach täglichem Volumen,
Und hast du von Coins noch nicht genug,
so studiere technisch den Chart,
und brauchst du Meinungen, so zöger nicht lang,
check die Analysen der Coins
und halt dich von FOMO und Shit Coins fern. @battle.24find
$PORTAL / PORTALUSDT
$PORTAL / PORTALUSDT

GOOD LUCK >>>
• Warning •
Any deal I share does not mean that I am forcing you to enter into it, you enter in with your full risk, because I'll not gain any profits with you in the end.
The risk management of the position must comply with the stop loss.
(I am not sharing financial or investment advice, you should do your own research for your money.)
BTCUSD BUY OPPORTUNITY IN M15 TIMEFRAME!
BTCUSD BUY OPPORTUNITY IN M15 TIMEFRAME!

Price surged High with strong buy momentum in H4 timeframe and recently traded a new all time high. This provides us with a potential buy opportunity as price currently trades at 117392.00 our target profit is at 119634
Dogwifpump?
Dogwifpump?

while all other high volume coins appear to have more downside coming in the next hours, dogwif is surprisingly very close flipping bullish for a small little push by the morning. This is very dependent on the next two hourly closes. we close strong, and the dog will see a small little pump. if the next two hourly candles move sideways our close lower, this is definitely seeing some lower prices
BITCOIN - Local Conditions for Growth Continuation
BITCOIN - Local Conditions for Growth Continuation

BTC
showed us an astonishing growth from $108,000 to $118,000 in a few days! But what is next and where is the next target?
At the moment the price is consolidating below the ATH, in fact there are two resistances: $118,500 and $119,000. To continue pumping, Bitcoin has to break both of them with strong impulse.
To be honest, the current price development reminds me of what we've seen a couple days ago: breakout of the resistance -> consolidation below local highs -> strong breakout and growth continuation. Something similar can be expected now as well.
In the past couple of years
BTC
taught us a lesson of waiting no time to hop on the train. When it pumps - it does it quickly, just like it does it this time. So, waiting for the best entry near $109,000 - $110,000 might leave you behind while Bitcoin will be pumping towards $125,000.
A Path into the TOP
A Path into the TOP

2W BTC - RSI is telling us we are at a pause - consolidation with a slight pullback is to be expected
RSI is tightening up and seems like it wants to consolidate a bit, maybe a slight dip down to run back up
The RSI here is not only giving direction its also giving us a possible top for price action into Oversold
$BAKE Trailing STOP
$BAKE Trailing STOP

Here is yet another trade on
BAKEUSDT.P
that pained me.
Not only that I followed it through the breakouts, I ate from the breakout after forming a rising wedge.
Then, I followed a ride back up immediately and had a sumptuous run too but when it started rallying and it was time for bed, I set a trailing stoploss to protect my profit. This stopped me out early before this major move Up.
I’m not angry as much because I protected not just my capital but profit.
But I’m still angry I didn’t win with the move that I foresaw.
BTC Trading Idee
ETH Trading Idee
Coin Übersicht
Telegram News.24find
24find Crypto & Forex News, Trading Ideen und Charts - 24find ~ find the Power. 24h Trading, TA, Technologien, Wissenschaft & News zum größten Teil durch Bots automatisiert.
#Bitcoin #Altcoin #Forex #Sozial Trading #MT4 #neue Medien # Tech
@finde24
Crypto Trading
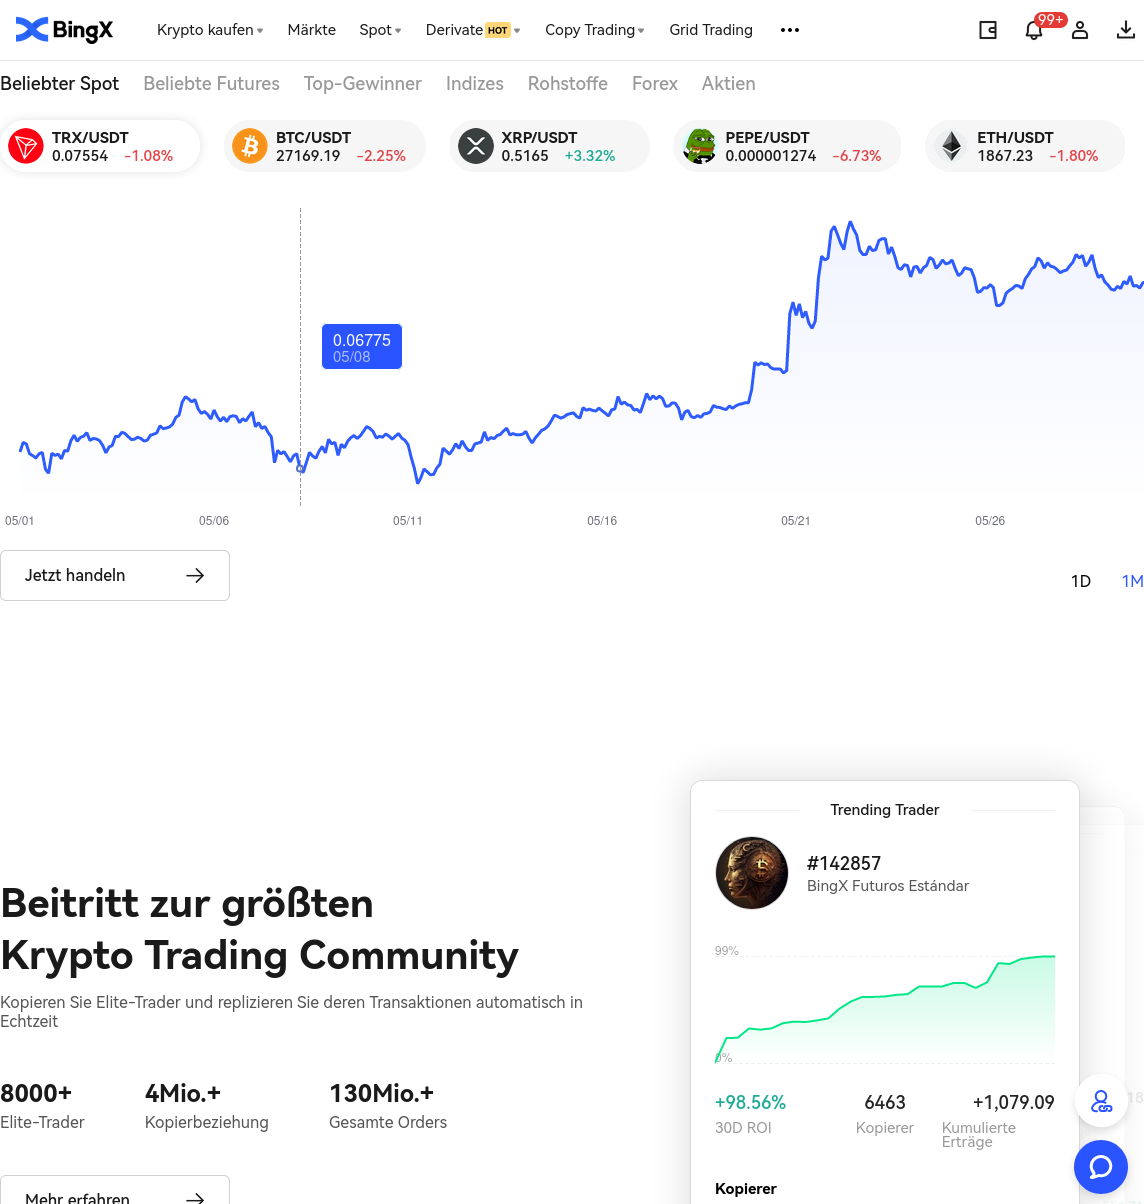
Interessiert? Schau einfach mal unter BingX nach.
schnelle ein und auszahlung großer COINs. hohe LIQUIidität, viele Paare, usw.
Average Transaktion Fee
Daily transaction fees divided by the number of transactions made on the Bitcoin and Ethereum blockchains. Chart uses 7-day moving average.
Trading Chat
Active Adresses
The number of unique addresses that were active in the network either as a sender or receiver. Only addresses that were active in successful transactions are counted. Chart uses 7-day moving average.
TA Bitcoin
TA Ethereum
TA Litecoin
Finanzierung & Spenden
Eine Spende motiviert nicht nur, sondern ermöglicht es auch weniger Werbelinks & Anzeigen zu schalten.
Bitcoin (BTC)
1H7wuuJ7jXE35qj5UQYbrKioD6n2AJU54R
Litecoin (LTC)
LPgVFnSG8ip3oZG55eDztbmdvQJuvnY5bq
Ethereum (ETH + TOKEN*)
0xa95C259282B03dA3f6307d6C61Af997F7df1591D
* Es können alle ERC20 Token auf Ethereum Basis an diese Adresse gesendet werden. Vielen Dank für deine hilfreiche Unterstützung.


